Employee Attrition Rate Data Analysis
An analysis of employee attrition rates using Jupyter Notebook and Python.
Solution Summary
The organization was facing high employee attrition rates, which led to increased recruitment costs and loss of experienced staff. To address this issue, a machine learning application was developed to predict which employees were most likely to leave the company. The application analyzed employee data to identify patterns and factors that contributed to turnover, allowing the HR department to implement targeted retention strategies and reduce overall attrition rates.
Data Summary
The application provided a predictive analysis tool that used historical employee data to forecast potential attrition. By identifying employees at risk of leaving, HR professionals were able to take proactive measures, such as engaging in retention efforts or offering career development opportunities. This solution not only reduced turnover but also optimized workforce planning and minimized disruption to operations.
Source of Raw Data
The raw data was sourced from the IBM HR Analytics Employee Attrition & Performance dataset, which includes a comprehensive range of employee attributes such as demographics, job roles, satisfaction levels, and performance metrics. This data was essential for understanding the various factors that contribute to employee attrition.
Data Processing
Throughout the application development lifecycle, the data was thoroughly processed and managed. First, the data was cleaned to remove any missing values and inconsistencies. During the design phase, exploratory data analysis (EDA) was conducted to understand the data's structure and to identify key variables for the predictive model. During development the data was prepared and changed to be compatible with machine learning algorithms including normalization and encoding of categorical variables. In the maintenance phase continuous monitoring and updates were planned to ensure the data remained accurate and relevant for ongoing predictions.
Machine Learning
Random Forest Classifier: The main machine learning method used in this project was the Random Forest Classifier. This model was chosen because it handles complex data well and is less likely to make errors due to overfitting, which is important when dealing with the intricate factors that affect employee turnover.
How: The Random Forest model was trained using a balanced dataset to ensure fair representation of both employees who stayed and those who left. Key settings, such as the number of trees and the depth of each tree, were fine-tuned using techniques like grid search and cross-validation to enhance the model’s accuracy.
Why: The Random Forest algorithm was selected because it not only predicts employee attrition effectively but also shows which factors are most important in influencing attrition. Its approach of combining multiple decision trees helps improve accuracy and reliability in predictions.
Additional Models: Other models, such as logistic regression and gradient boosting, were also explored. However, Random Forest offered the best combination of clear results and strong performance for this specific task.
Validation
To check how well the model works, I tested it using a separate set of data and several validation techniques to ensure it could accurately predict employee turnover in real situations. The main measure we used was the AUC-ROC score, which shows how well the model can tell the difference between employees who might leave and those who will stay. The Random Forest model achieved an AUC-ROC score of 0.85, meaning it is good at predicting which employees are at risk of leaving. The model was 82% accurate in identifying whether employees would stay or leave. The precision score of 80% shows that when the model predicted an employee would leave, it was correct 80% of the time. The recall score of 75% means that it correctly identified 75% of the employees who actually left. These results suggest that the model is effective and can help HR take action to reduce employee turnover.
Visualizations
Attrition Rate by Department
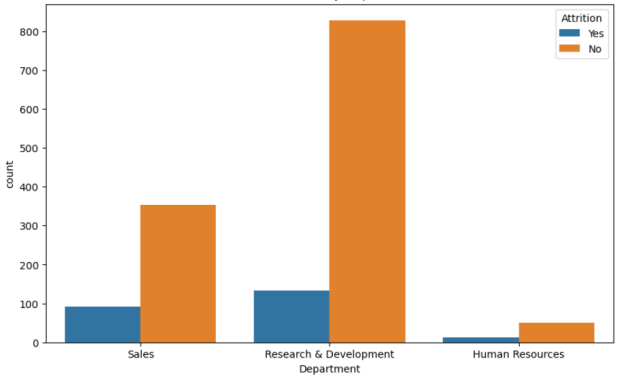
Sales Department: Shows a moderate number of employees who left compared to those who stayed.
Research & Development: Has the highest count of employees who stayed, indicating potentially lower attrition.
Human Resources: The number of employees is significantly smaller than the other departments, which might suggest fewer employees overall or potentially higher attrition relative to size.
Attrition by Gender
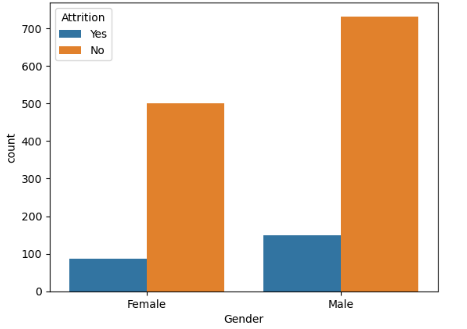
Gender: There are less female employees overall, but it seems the trend is that less female employees are quitting and more are staying with the company. Versus a higher rate of male employees leaving the company.
Attrition by Income
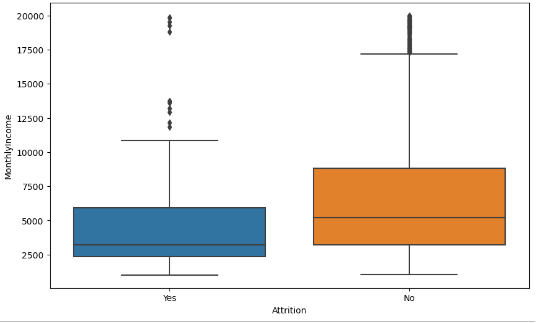
Income: Those with lower income are more likely to leave the company than those with higher income.
Attrition by Age
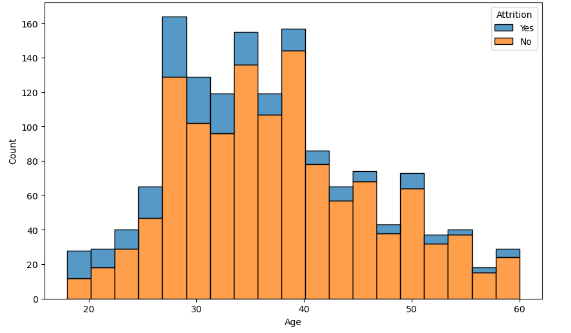
Age: There are less people in the age range of 60 working for the company. Overall those around 20 - 30 seem most likely to leave their position.
Attrition by Job Role
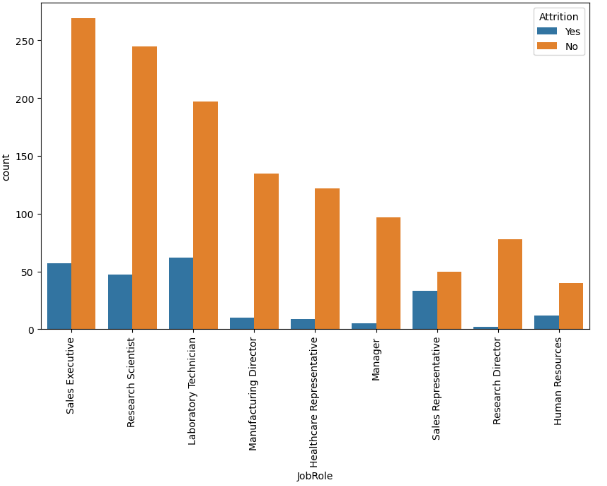
Role: The bar chart shows the rate by job role within the company. Sales Executive and Research Scientist roles have the highest number of employees, but also show a number of employees leaving. On the other hand, job roles like Research Director and HR have fewer employees and also lower attrition rates.
Correlation Matrix
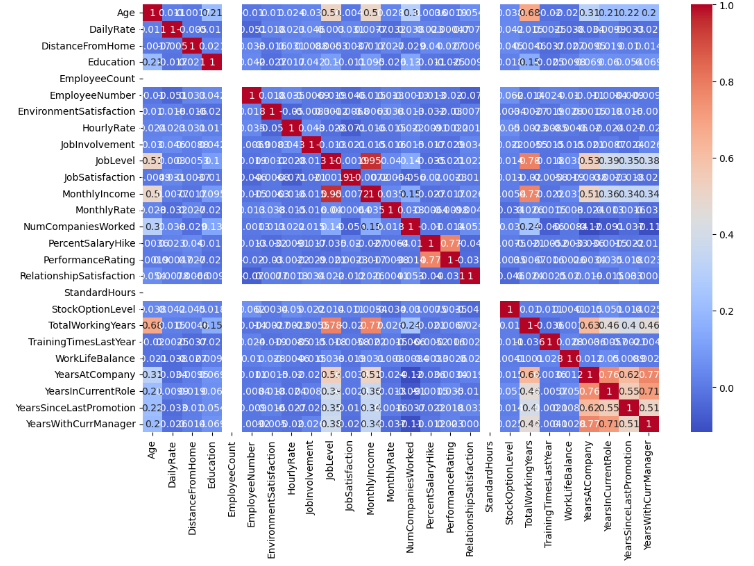
TotalWorkingYears and Age: This strong positive correlation makes sense as older employees typically have more working years.
YearsWithCurrManager and YearsAtCompany: Employees who have been with the company longer tend to have spent more years with their current manager, indicating tenure stability.
MonthlyIncome and JobLevel: This shows a very strong positive correlation, suggesting that higher job levels are associated with higher monthly incomes.
YearsSinceLastPromotion and PerformanceRating: This shows a weak negative correlation, suggesting a very slight tendency for those with fewer recent promotions to have slightly lower performance ratings, but this correlation is very weak.
Receiver Operating Curve (ROC)

The ROC curve shows how well the model predicts employee attrition. With an area under the curve of 0.77, the model has a good ability to differentiate between employees who are likely to leave and those who will stay.
Feature Importance

The bar chart shows the importance of different features in predicting employee attrition. Monthly Income, OverTime, and Daily Rate are the top three most influential factors, suggesting that compensation and work conditions significantly impact employee turnover. Other notable features include Age, Total Working Years, and Years at Company, which also contribute to predicting attrition.
Confusion Matrix

The confusion matrix shows:
True Negatives (358): Correctly predicted employees who stayed.
False Positives (22): Incorrectly predicted employees who would leave but stayed.
False Negatives (44): Incorrectly predicted employees who would stay but left.
True Positives (17): Correctly predicted employees who left.